Why Building Transit Costs So Much (Part 1): We Overbuild
Bigger isn't better when it means building less
(A must-read and source material: Transit Costs and Understanding the Costs of Transit Construction)
No single issue threatens the proliferation of public transit in the U.S. and Canada more than the time and cost it takes to build it.
Projects like California High-Speed Rail or New York’s Congestion Pricing face fierce backlash not just because of what they are, but because people no longer trust our ability to execute them. Our institutions have lost credibility.
The truth is, we haven’t been able to build transit efficiently at scale since the 1970s. The costs are staggering, and the timelines are embarrassing. And while there are many reasons we’ve reached this point, the first one I’ll tackle is simple:
We overbuild. Dramatically.
Why Do We Go Big?
It’s hard to pinpoint a single reason, but building bigger than necessary is a nearly universal issue across the U.S. and much of the Anglosphere.
My hypothesis is that most transit projects fall into one of two categories:
Pet projects pushed by elected officials, or
Deferred infrastructure renewal that’s long overdue for attention
Rarely do these projects emerge from a genuinely holistic planning process rooted in agency need and expert guidance. Instead, they’re shaped by political will, which often means they have to be flashy, not just functional. After all, pet projects aren’t utilitarian by their nature.
Take the failed King of Prussia rail extension as an example. It was a proposed $3 billion, 4-mile extension to a shopping mall that would’ve moved at most 10,000 riders daily. The real motivation? Satisfying board members representing suburban geographies. Compare that to long-standing, high-need projects like the Roosevelt Boulevard Subway in Philadelphia that remain unfunded.
There’s a persistent belief that big, shiny transit projects attract riders. There’s absolutely some truth to that. But ridership isn’t sustained by grandeur, it’s sustained by reliable service and smart land use.
It wasn’t always this way. Earlier systems relied on repetition as a feature.
Repetition As a Feature
A common refrain when opposing housing, transit, or policy reform seen working well in other places is, “Well, we’re America.” You can hear a version of this at every level of government even down to the HOA. It’s often used as a lazy but effective excuse for keeping the status quo.
That same attitude shows up in how we build transit. Stations are expected to be architecturally unique, and project delivery routinely ignores global best practices because, well, “we’re [insert your locality here].”
The root problem to our overbuilding and overdesign problem? We don’t have a standard, utilitarian design template to replicate at an agency level.
Contrast that with the original Washington Metro, which followed a uniform architectural blueprint that’s repetitive, efficient, and quick to build. Walk into nearly any downtown DC Metro stop and, aside from signage, you’d struggle to tell them apart. That’s a feature, not a flaw.

Standardization makes sense: It simplifies design, procurement, and construction. The more we stray from it, the more costly and delayed our projects become.
The Famous Second Avenue Subway
We have to talk about the most expensive subway project per mile in modern history when talking our cost problem: Second Avenue Subway Phase 1. The cost? A staggering $2.714 billion per mile.
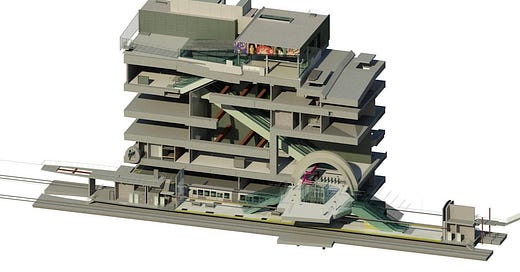
According to Transit Costs Project (a must-read), overbuilding was a major contributor. A full 77 percent of the total cost went into constructing just four stations, as no station was alike.
“Stations differ from each other in terms of overall length, depth, construction techniques, location of ancillary facilities, finishes, number of elevators and escalators, crossovers, and the amount of back-of-house space for technical rooms” - Transit Costs

How bloated were they? The station boxes were 995 feet, 359 feet, and 981 feet longer than the actual train platforms. Combined, their back-of-house space totaled 231,848 square feet. For comparison, the average suburban Walmart is 179,000 square feet.
Lessons Learned from Phase 1
The scrutiny of Phase 2 has been scrutinized (and rightly so). Planners were under pressure to avoid repeating the mistakes of Phase 1.
One example: the Harlem–125th Street station. The 2004 design extended nearly a full city block beyond the platform, using a far bulkier footprint than the leaner templates used to build standardized systems like WMATA, BART, and MARTA in the 1970s.
Thanks to public pressure, the work of the Transit Costs and Prof. Eric Goldwyn, and an overall shift in mindset, the final design for Harlem–125th is far more compact, and the MTA also opted to reuse an existing tunnel from the 1970s.
The result? A projected savings of more than $1 billion.
Example 1: Milpitas BART vs. Skytrain
Silicon Valley Phase 1, the most recent BART expansion, added Milpitas and Berryessa (San Jose) stations. It cost $230 million per mile, which is not nearly the most expensive in the U.S., but still high for the context of a sunken/elevated rail one.
Milpitas BART was built to handle over 20,000 daily riders*, yet today it sees just **1,053 riders on average. The 20 acre station complex includes:
A 1,631-space parking lot and garage
A pedestrian bridge connecting to VTA Light Rail
A 14-bay bus terminal
A large mezzanine
Two side platforms below grade
Total interior station area: 68,800 square feet
Now compare that to Metrotown Station on Vancouver’s SkyTrain system in Burnaby, BC. It sees 22,500 daily riders (2nd busiest in the network), more than 20 times Milpitas, but occupies just 10,400 square feet.
Example 2: San Francisco vs. Turin
North of Milpitas, San Francisco’s Central Subway is a 1.7-mile light rail extension connecting Mission Bay to Chinatown. Its goal: relieve congestion on the Market Street corridor and serve a dense, transit-reliant neighborhood. The cost for this 1.7-mile, 4-station (3 underground) light rail project? $1.95 Billion.
According to a 2022 report, $1.168 billion, 60% of the total cost, went toward stations. The Union Square/Market Street station alone costs $314 million, while the Chinatown station costs $392 million. These are huge sums for a line serving 150-foot trains.
Why so expensive? Each station was uniquely designed as a blank canvas for each neighborhood they served, creating overbuilt infrastructure and very distinct layouts and problems the project team had to solve for.
Now compare that to Turin, Italy, a city with a similar population.
Over the past two decades, Turin built the automated 9.4-mile M1 Metro line for a weighted average of $183.7 million per mile. Designed to move 23,000 people per hour per direction, it includes 27 stations, which together cost $558.13 million (2024 USD). That’s less than the cost of just two Central Subway stations, while providing far more capacity.
Why so much cheaper? The first four phases of M1 stations follow a nearly identical standardized template (diagram below), ensuring utility and compact design, yet are still capable of moving more people than the Central Subway (projected 43k ridership) and exceeding the current ridership of the Milpitas BART station.

“The reason behind consistent costs across stations is an extremely standardized design. In the first four phases, all the stations but four have the same exact design. The bulk of the typical 30,000 cubic meter volume of each standard station is made of a 65m x 22m box, 21m deep with track located at approximately 16.5m below the surface” - Transit Costs
The takeaway? Turin built 27 stations for less than San Francisco spent on just two, and moved more people doing it.
Honorable Mention: Highway 407
Opened in 2017, the Highway 407 station in Vaughan, Ontario, was designed as a park-and-ride hub for drivers coming off the highway and for suburban bus routes connecting the area.
While the goal was sound, the execution was excessive. The station and its bus terminal span five levels, making it one of the largest stations on Line 1, yet with just 7,650 daily riders, it remains among the least-used in the system.
Canada’s transit construction costs mirror those of the U.S., and Highway 407 is another example of how overbuilding and overdesign plague both countries.
Why does it matter?
The cost of building just three underground Central Subway stations could have funded 35 Turin Metro stations if we adopted the kinds of reforms that make standardized, efficient construction possible. The pedestrian bridge linking light rail to Milpitas BART alone costs more than a whole new Turin station.
Yes, America is different. But even if our costs were cut in half, not down to Turin levels, just halfway, we could double the amount of infrastructure with the limited transit expansion dollars we are thrown. And in this political climate, that’s a fight worth having.
I love beautiful public spaces. I love feeling respected as a transit rider. But I and most transit riders would happily trade a far smaller concourse for more transit lines that actually go where people need them.
In the next part of this series, I’ll talk about our lack of in-house capacity being the second reason for our transit cost issues.
See you in the next part of this series.
*SV BART Phase 1 projected 46,458 riders in total for both stations.
**BART system ridership has slowly increased since the pandemic and the adoption of remote work, and it has been steadily rising. The original projections included Phase 2 connections that have not yet opened, and the station opened during the lockdown.